Ottawa, Feb. 06, 2026 (GLOBE NEWSWIRE) -- The global data center industry is expanding at a rapid pace, with increasing electricity demand, higher infrastructure costs, and a growing emphasis on sustainability. Data center operators are focusing on improving energy efficiency through technologies like renewable energy integration, AI-driven power management, and advanced cooling systems. These investments are crucial for addressing the rising demand for computing power while minimizing environmental impacts.
Invest in Our Premium Strategic Solution: https://www.precedenceresearch.com/request-consultation/46
Global Energy Consumption & Efficiency Metrics in Data Centers
Data centers are major consumers of electricity, and their energy usage is directly impacted by the rising demand for AI and cloud computing workloads. The table below outlines the global electricity consumption and the role of AI in contributing to the surge in energy demand.
| Topic / Metric | Actual Figures / Facts | Notes & Sources |
| Global Electricity Consumption (2024) | 415 TWh of power consumed by data centers worldwide (~1.5% of global electricity demand) | IEA estimates. |
| Data Center Energy Growth | Electricity consumption grew ~12% per year over the last 5 years | IEA analysis. |
| Total Power Demand (2024) | Data center capacity nearly 100 GW globally | IEA power demand report. |
| Global AI Impact | AI workloads contributing to surging energy demand with potential to double consumption by 2030 | IEA and WSJ reporting. |
| U.S. Data Center Electricity Use (2023) | 176 TWh (~4.4% of total U.S. electricity) | U.S. DOE and LBNL data. |
| Industrial Share of Server Energy (2023) | 80% of server energy used by hyperscale & colocation centers | Lawrence Berkeley 2024 Report. |
| PUE Efficiency (Industry Metric) | Fleet/large facilities showing PUE ≈1.09 (Google example) | Reported by Google data centers. |
| Water Use in Centers | Up to 5 million gallons/day per large facility | Water consumption studies. |
| Renewable Energy Share (Industry Avg) | 27% of electricity from renewables in data centers | Data Center Dynamics estimate. |
| Power Grid Mix | Renewables + natural gas are primary growth sources for future data center energy | IEA energy supply reports. |
Key Insights:
- Data centers account for 1.5% of global electricity demand, a number expected to grow, especially with the rise of AI workloads.
- Hyperscale data centers consume the majority of server energy, with large facilities operating at impressive PUE (Power Usage Effectiveness) rates like 1.09, a mark of energy efficiency.
- Renewable energy currently accounts for 27% of data center energy usage, but the push for 100% renewable energy is gaining traction among industry leaders like Microsoft, AWS, and Google.
Energy & Sustainability Metrics for Leading Data Center Operators
Many data center operators are making significant strides toward improving energy efficiency and sustainability. Below are the key energy and sustainability metrics for some of the largest operators in the industry.
| Company | PUE (Power Usage Effectiveness) | Renewable Energy Coverage | Energy Initiatives / Power Projects | Notes / Source |
| Equinix | Avg 1.39 PUE (2024) | 96% renewable energy globally | Power purchase agreements + advanced nuclear partnerships (>1 GW) | Achieved renewable coverage, improving PUE vs prior year; clean power deals with Oklo and Radiant Nuclear. |
| Microsoft | ~1.17 PUE global average FY25 | 100% carbon-free electricity by 2030 | 10B+ renewable energy deal (10.5 GW) for wind/solar capacity | Detailed PUE/WUE metrics; long-term renewable procurement strategy. |
| Amazon Web Services | ~1.15 PUE global average (2023) | Aims for 100% renewable energy by 2025 | Region-specific data center efficiency investments | Reports best-performing PUE ~1.04; ongoing improvements annually. |
| Google LLC | ~1.09 fleet-wide PUE | 100% renewable energy | Water stewardship programs + clean grid sourcing initiatives | Emphasizes sustainability with strong focus on water and energy balance. |
| Iron Mountain Data Centers | Not officially published PUE | 100% renewable powered claims | On-site solar installations and natural cooling systems | Recognized for eco-friendly data center operations. |
| Meta Platforms (Facebook) | Not publicly disclosed specific PUE | Commits to 100% renewable energy | Renewable purchase agreements and carbon reduction targets | Sustainability tied to company-wide clean power goals. |
| Digital Realty | Not published overall PUE | 100% renewable commitment | Investing in efficient cooling & clean power sourcing | Renewable goals and clean energy sourcing for facilities. |
Key Insights:
- Equinix and Microsoft lead in renewable energy coverage, with Equinix achieving 96% coverage and Microsoft on track to match 100% carbon-free electricity by 2030.
- AWS and Google continue to focus on energy efficiency improvements, with PUEs dropping year-over-year, driven by significant investments in regional data center optimization.
Manufacturing & Infrastructure Costs for Data Centers
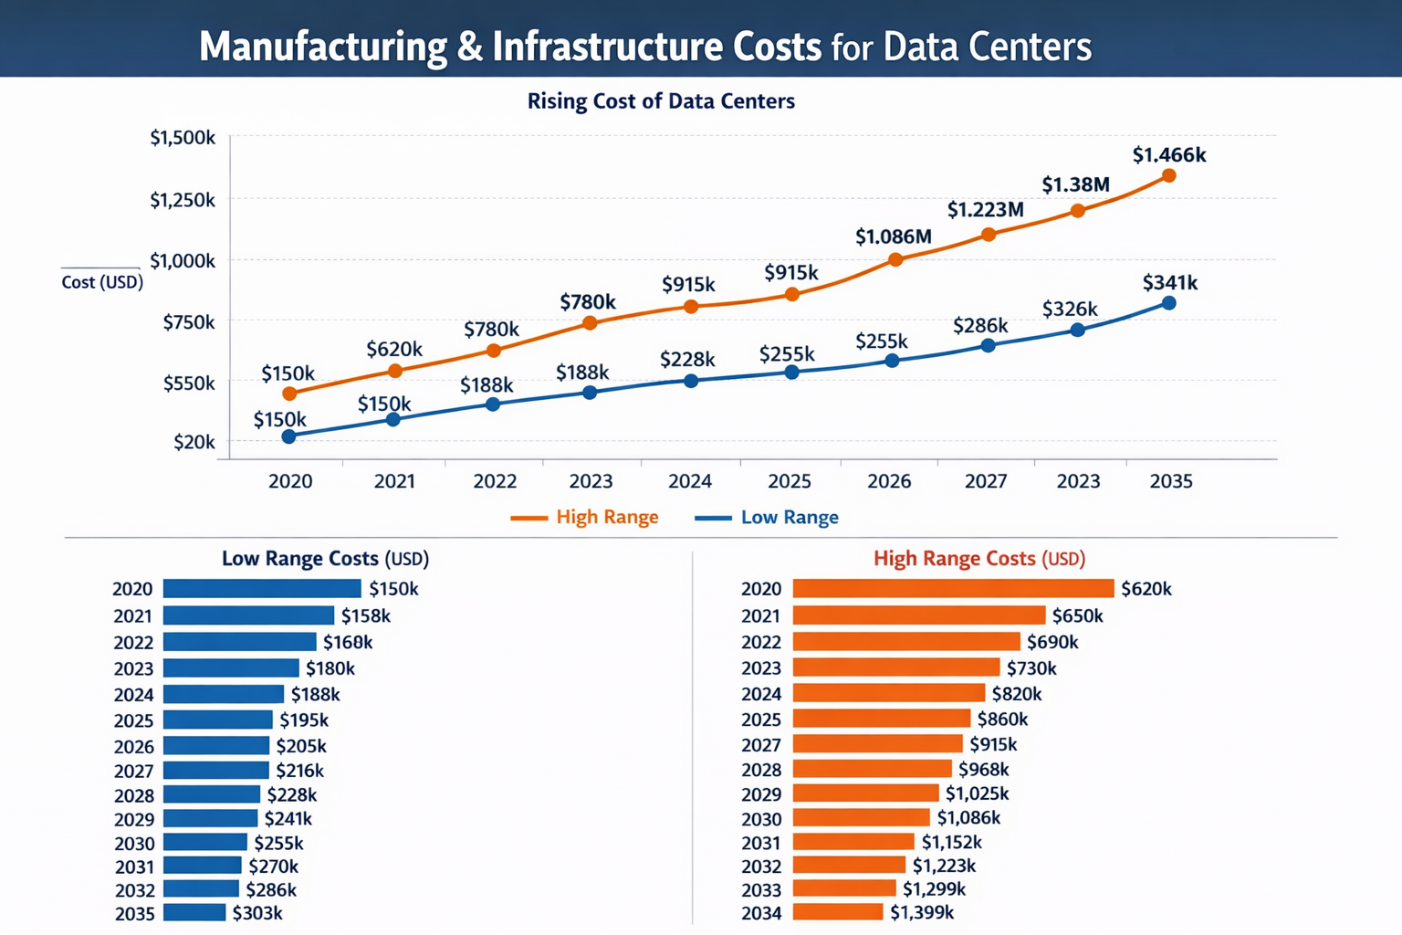
The manufacturing costs associated with building data center infrastructure, including servers, racks, cooling systems, and power infrastructure, have been steadily rising as the demand for capacity and performance increases. The following table outlines the typical cost ranges for manufacturing core data center components:
| Year | Low Range (USD) | High Range (USD) |
| 2020 | 150,000 | 620,000 |
| 2021 | 158,000 | 650,000 |
| 2022 | 168,000 | 690,000 |
| 2023 | 180,000 | 730,000 |
| 2024 | 188,000 | 780,000 |
| 2025 | 195,000 | 820,000 |
| 2026 | 205,000 | 865,000 |
| 2027 | 216,000 | 915,000 |
| 2028 | 228,000 | 968,000 |
| 2029 | 241,000 | 1,025,000 |
| 2030 | 255,000 | 1,086,000 |
| 2031 | 270,000 | 1,152,000 |
| 2032 | 286,000 | 1,223,000 |
| 2033 | 303,000 | 1,299,000 |
| 2034 | 321,000 | 1,380,000 |
| 2035 | 341,000 | 1,466,000 |
Key Insights:
- Lower range costs (~150,000–341,000) are typically for smaller, modular facilities or edge deployments, while the higher range (~620,000–1.466M) is for large hyperscale data centers with high-performance capabilities.
- These costs cover critical components like servers, storage, and cooling systems, and can increase as complexity and requirements for capacity and redundancy grow.
Selling Prices for Data Center Systems & Deployment
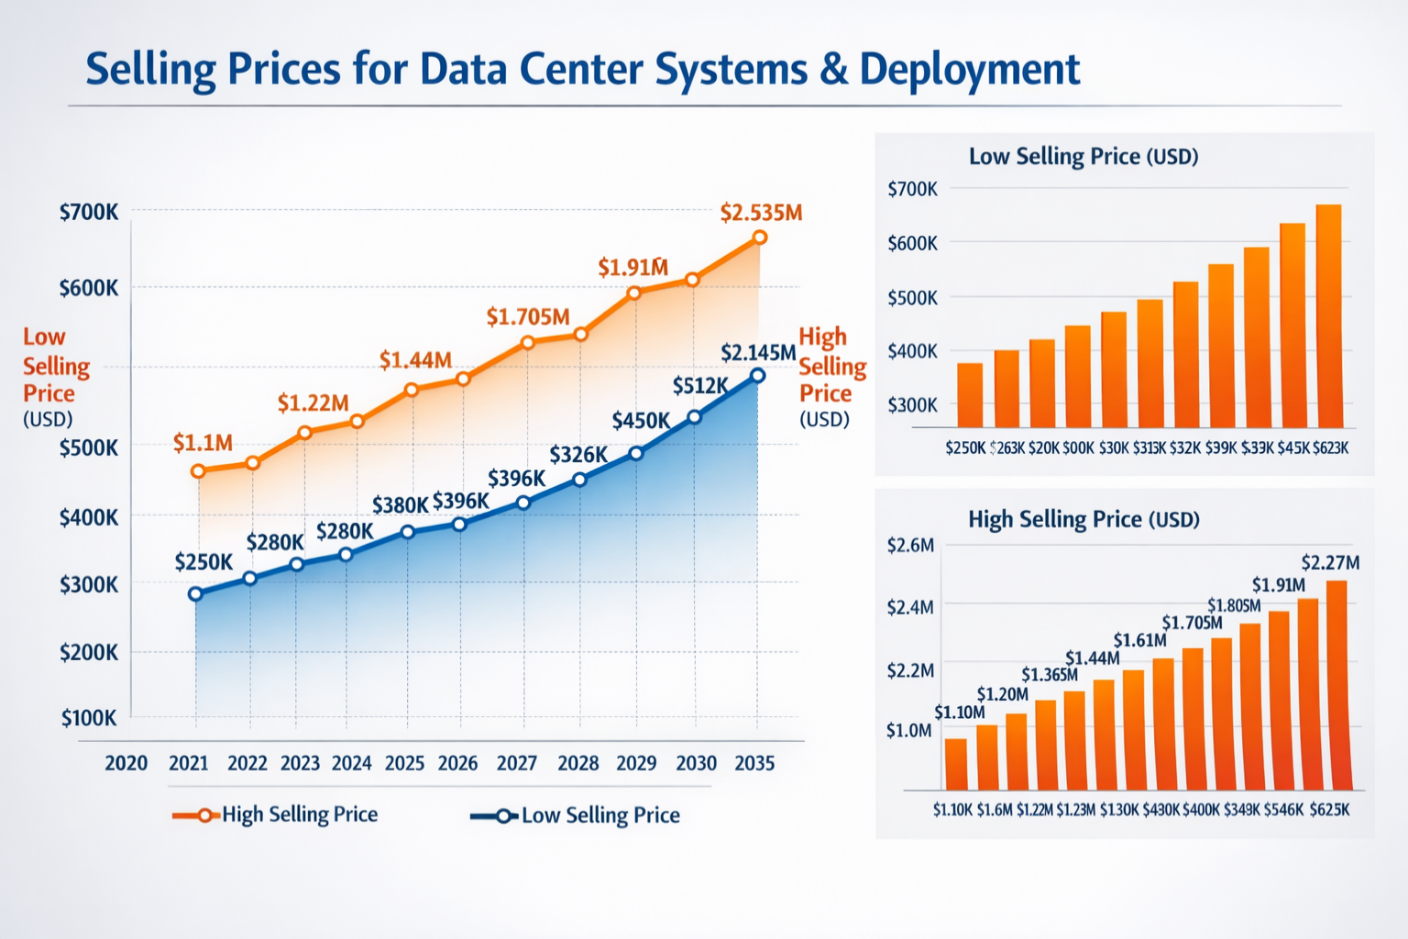
While manufacturing costs are essential, the final selling prices for data center systems also include integration, delivery, software, and support costs. The table below illustrates the estimated selling prices per site or deployment, factoring in these additional elements:
| Year | Low Selling Price (USD) | High Selling Price (USD) |
| 2020 | 250,000 | 1,100,000 |
| 2021 | 263,000 | 1,155,000 |
| 2022 | 280,000 | 1,220,000 |
| 2023 | 300,000 | 1,290,000 |
| 2024 | 315,000 | 1,365,000 |
| 2025 | 330,000 | 1,440,000 |
| 2026 | 350,000 | 1,520,000 |
| 2027 | 372,000 | 1,610,000 |
| 2028 | 396,000 | 1,705,000 |
| 2029 | 422,000 | 1,805,000 |
| 2030 | 450,000 | 1,910,000 |
| 2031 | 480,000 | 2,025,000 |
| 2032 | 512,000 | 2,145,000 |
| 2033 | 546,000 | 2,270,000 |
| 2034 | 583,000 | 2,400,000 |
| 2035 | 623,000 | 2,535,000 |
Key Insights:
- Low-end selling prices reflect small or edge data center deployments, while high-end prices correspond to large enterprise or hyperscale installations with full integration, extensive networking, cooling systems, and security features.
The Future of Data Centers and Energy Sustainability
As the demand for data and computing power continues to rise, data centers will play a critical role in shaping the digital infrastructure of the future. From AI-driven optimizations to renewable energy initiatives, companies are increasingly focused on improving both energy efficiency and sustainability. With investments in cutting-edge technologies, like advanced cooling systems and AI-powered energy management, the industry is adapting to meet growing demands while reducing environmental impact. As costs rise and technology advances, these investments will be pivotal to maintaining the balance between operational efficiency and sustainability in the coming decades.
Request Research Report Built Around Your Goals: sales@precedenceresearch.com
About Us: Precedence Research
Our Legacy: Rooted in Research, Focused on the Future
Looking for research that drives real results? Precedence Research delivers strategic, actionable insights, not just data and charts. Based in Canada and India, our team specializes in customized market analysis, executive-level consulting, and tailored research solutions that go beyond traditional survey methodologies to support business growth with precision and confidence.
Insight-Driven
We turn complex data into clear, strategic insights that power confident business decisions.
Innovation-Led
We continuously refine our methods to stay ahead of trends and emerging market forces.
Industry-Agnostic
From tech to healthcare, we serve clients across sectors with tailored, actionable intelligence.
Customer-Centric, Future-Focused, Result-Oriented
We work as strategic partners, engaging deeply with clients to co-create impactful solutions.
Our Commitment: Delivering Intelligence That Drives Transformational Growth
What do we do? We turn data noise into clarity. Through sharp research, agile thinking, and tech-enabled tools, we fuel brands, disrupt markets, and lead with insight that drives unstoppable growth.
Contact Us
USA: +1 8044 419344
APAC: +61 4859 81310 or +91 87933 22019 or +6531051271
Europe: +44 7383 092 044
Email: sales@precedenceresearch.com

![]()